Automatic Reference Counting with `self`
Recently, when working on Jared, I ran into an interesting memory leak. Jared is written nearly entirely in Swift, which uses ARC for memory allocation. As advertised, it usually “just works”. However in this case some of my callback code had unintended side effects.
Jared contains the ability to load .bundle plugin files to add additional commands. These bundle contain a principle class which conforms to a protocol and is loaded dynamically at runtime. In this instance, I was experimenting with a bundle whose class started a HTTP web server using Telegraph.
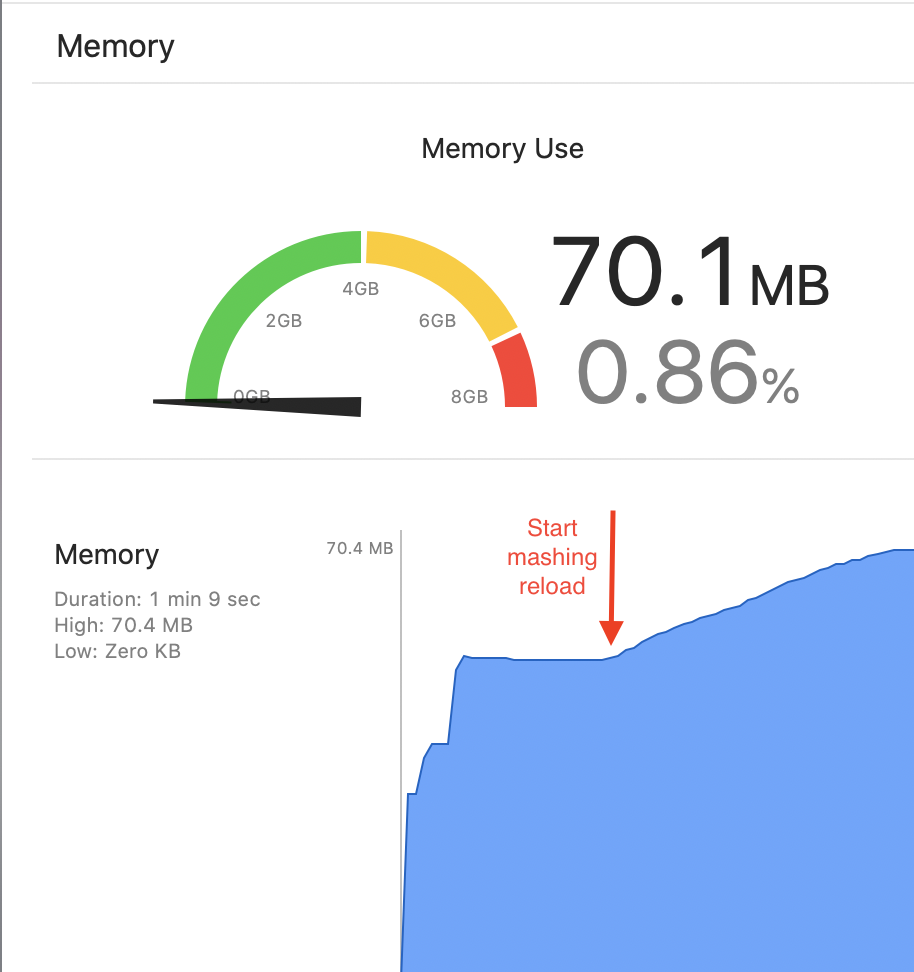
I originally noticed strange behavior because when reloading plugins. The application would crash upon reload, due to the server trying to re-bind the same port, even though I was stopping the server in the module’s deinit statement. Setting a breakpoint, the deinit was never called.
After unloading the server module, I ran an experiment by mashing the reload plugins button repeatedly.
Digging into Xcode’s Debug Memory graph, and filtering on filtering on leaked blocks, it’s clear that old copies of RoutingModules are sticking around in memory.
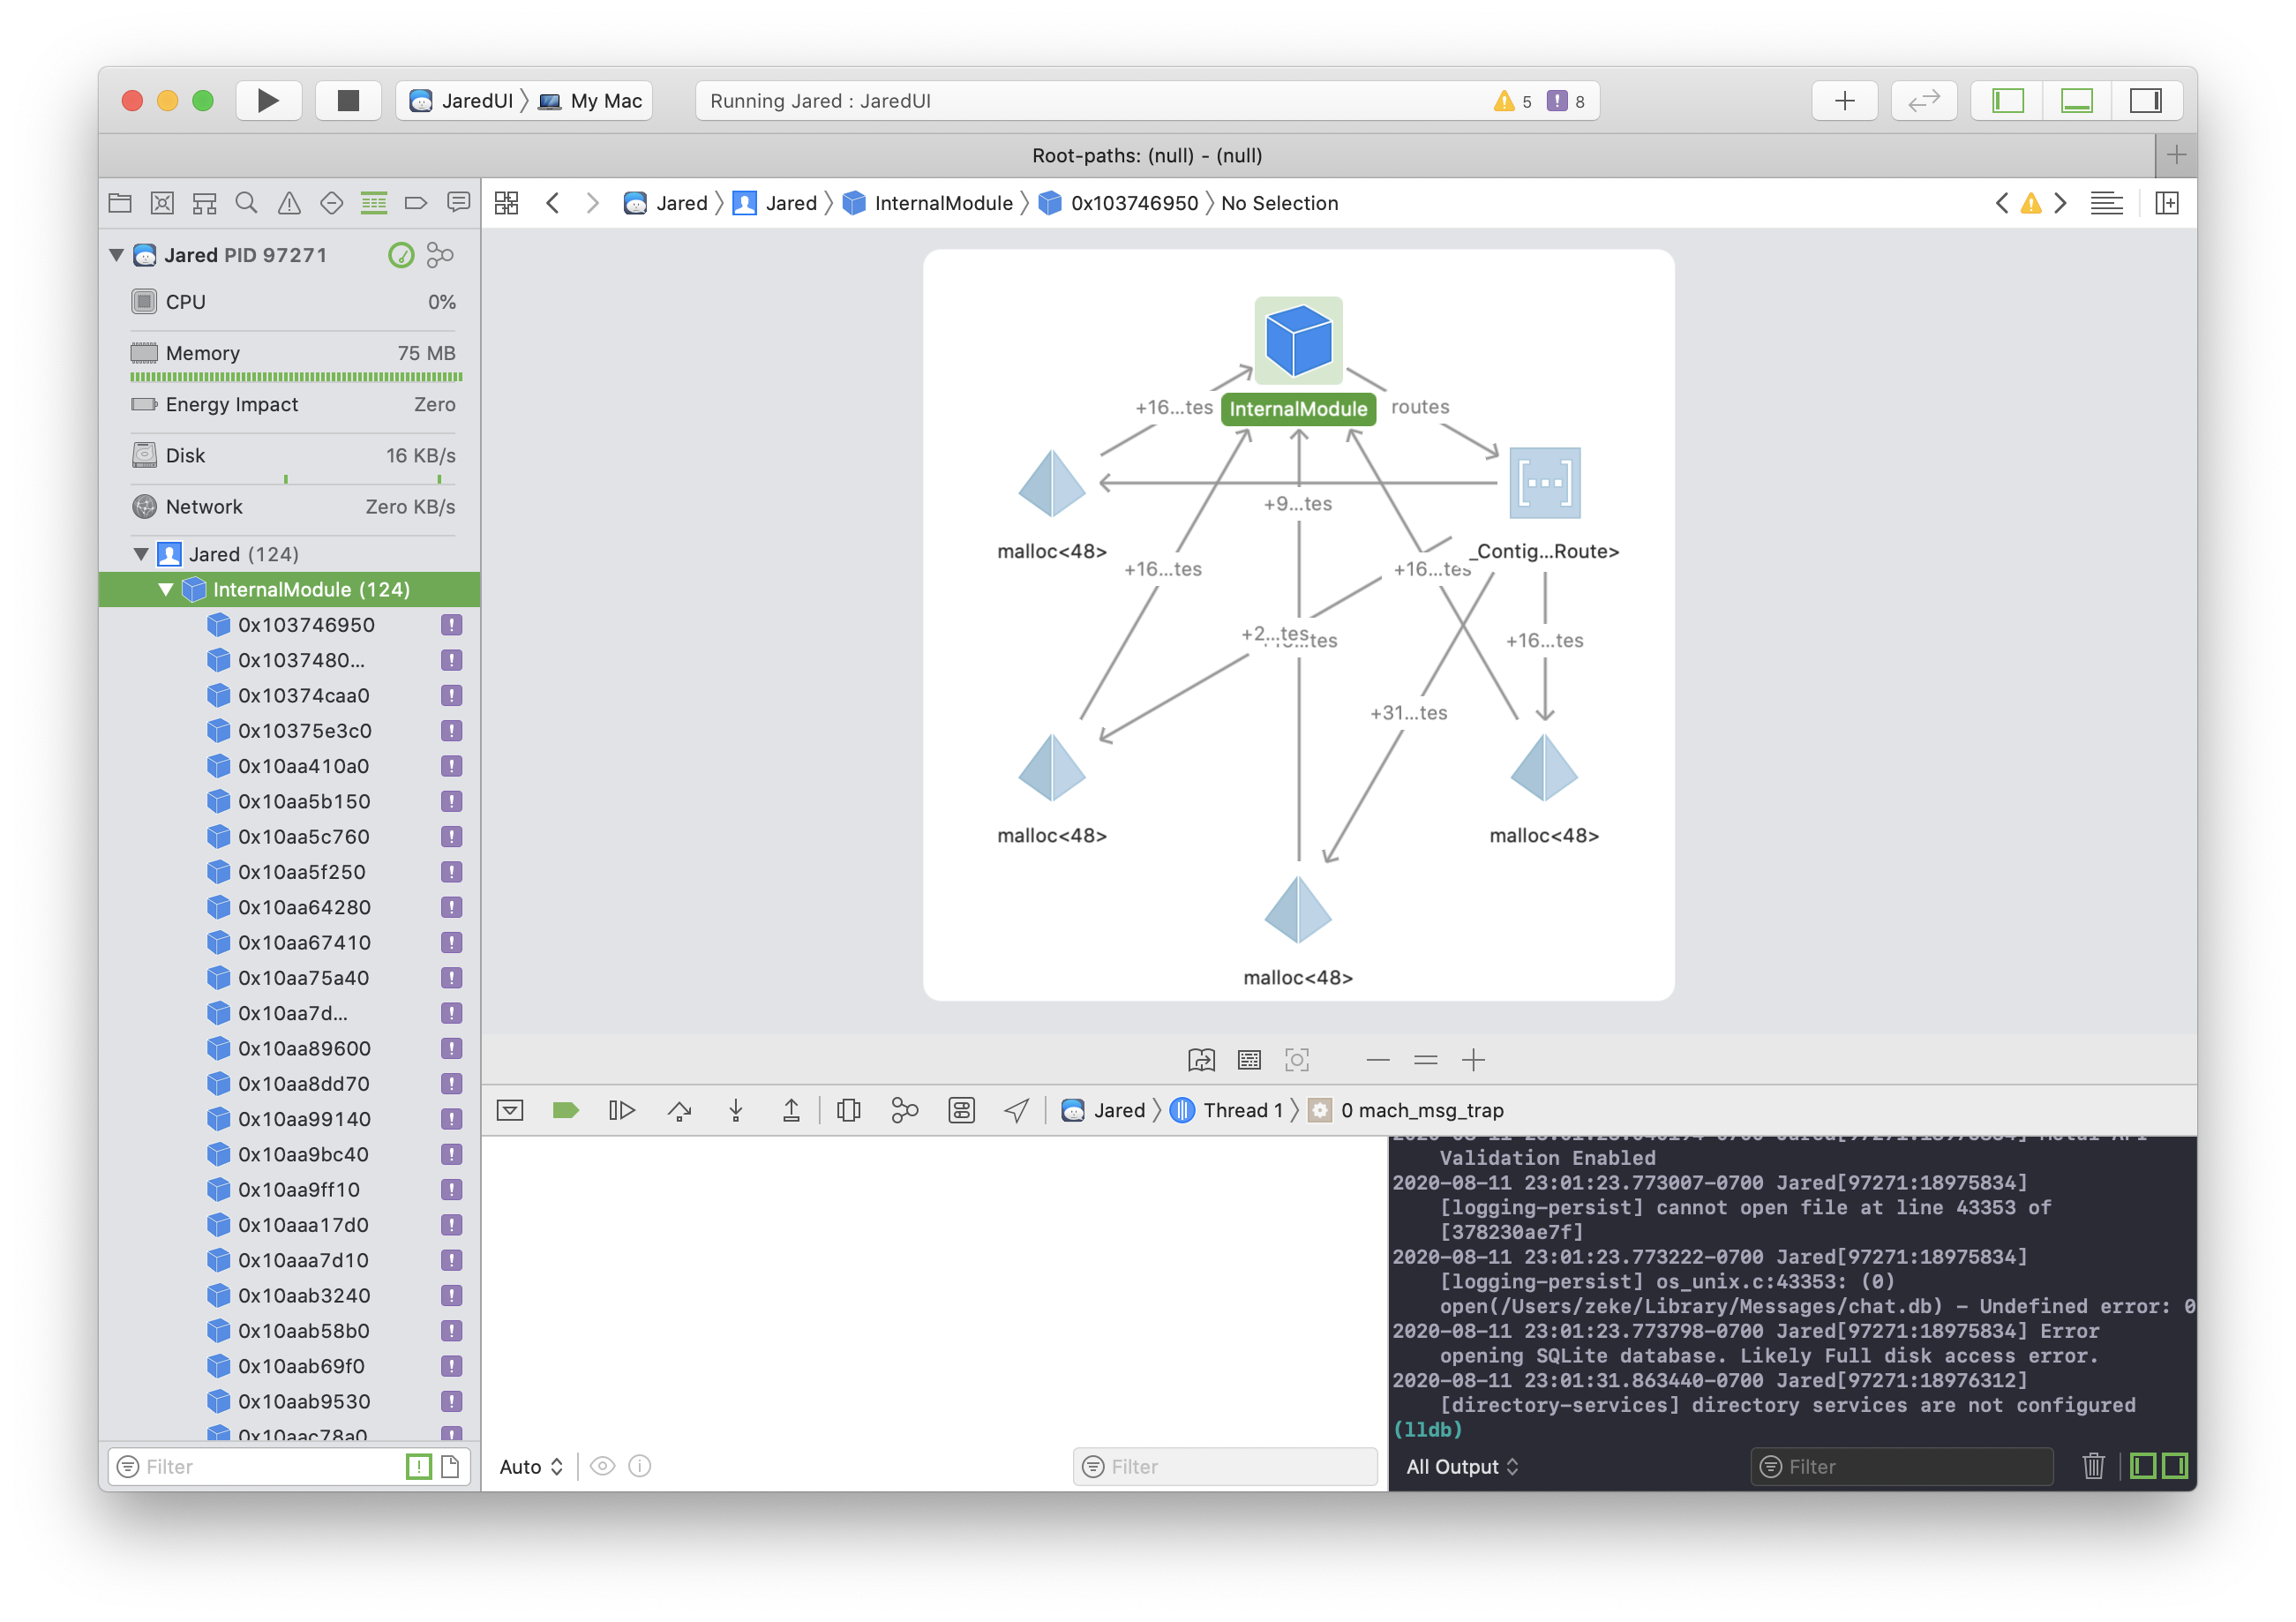
Looking closer into the pertinent part of the memory graph:
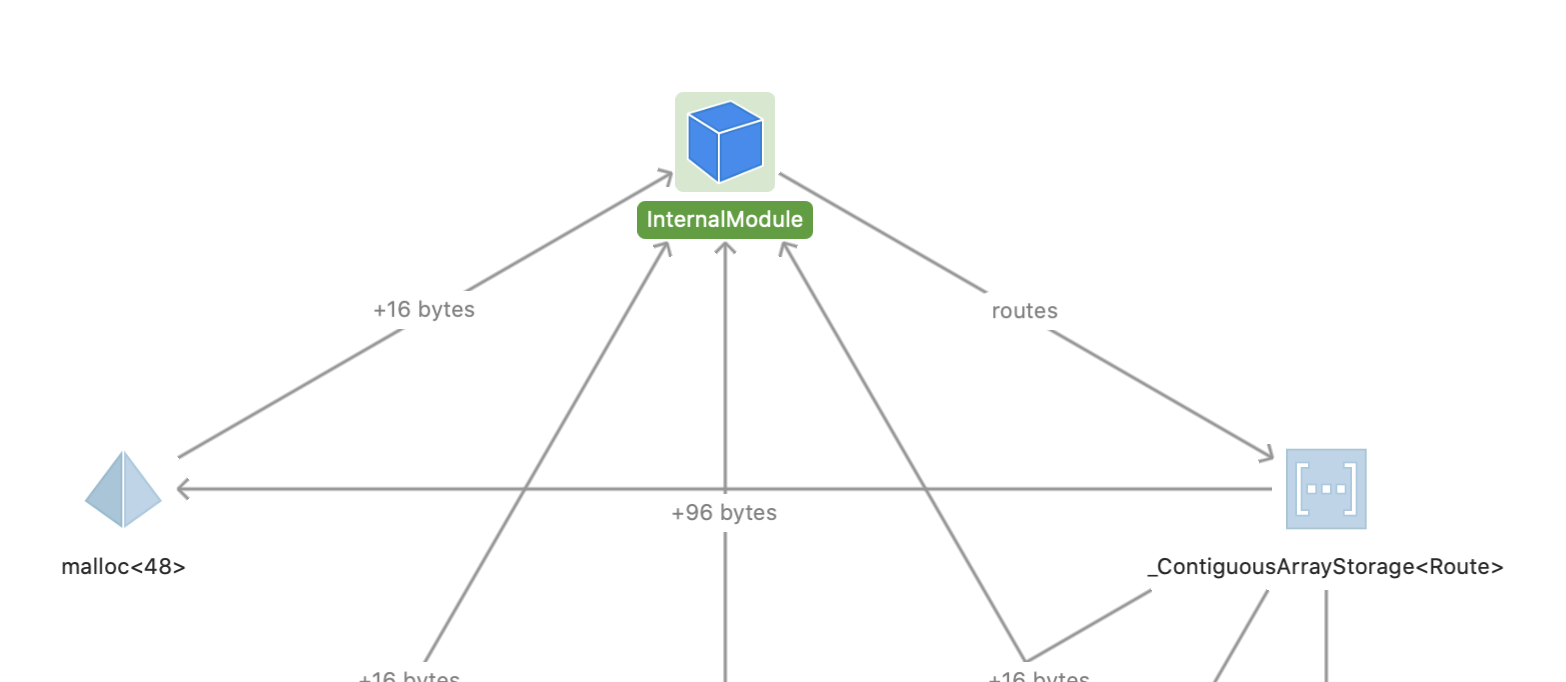
The route has a clear strong reference cycle between itself and an array, causing it to stick around. All modules do provide an array of routes. Narrowing down the pertinent code:
var routes: [Route] = []

init() {
    let reload = Route(name:"/reload", comparisons: [.startsWith: ["/reload"]],
      call: self.reload, description: localized("reloadDescription"))

    routes = [reload]
}

func reload(_ message: Message) -> Void {}
After some research, it was evident that the issue lied in the reference to a self method in the callback parameter. The purpose of the callback is to provide the routing module with the appropriate method to call when a triggering message is received. It is not meant to live beyond the memory scope of the containing class. However, because it was a strong self reference, it was causing any module to never be deallocated. The class contained a list of elements that depend on itself, so as far as ARC is concerned, the resource never reached a zero reference count.
This behavior is explicitly called out in the Swift documentation:
A strong reference cycle can also occur if you assign a closure to a property of a class instance, and the body of that closure captures the instance. This capture might occur because the closure’s body accesses a property of the instance, such as self.someProperty, or because the closure calls a method on the instance, such as self.someMethod(). In either case, these accesses cause the closure to “capture” self, creating a strong reference cycle.
As a simple solution, I simply provided the callback as a weak self reference instead:
let reload = Route(name:"/reload", comparisons: [.startsWith: ["/reload"]],
  call: {[weak self] in self?.reload($0)},
  description: localized("reloadDescription"))
The weak reference allows you to reference self, without keeping a strong hold on it. This prevents a strong reference cycle, and allows my Module classes to be deallocated appropriately. After changing to a weak self reference in all Routes, the issue resolved itself, and I’m free to mash that reload button without incurring a memory leak. Thus solving a long lived bug in my application.
tl;dr: You should be very careful when using self in callbacks. It is very likely that you should use a reference to weak self instead of a strong reference.